Lab 11: Implement Monitoring with Azure Monitor
A
I’m Amir Rouhanipoor, an IT Consultant specializing in Azure and cloud solutions. I help organizations streamline their IT and drive growth through secure, efficient cloud technologies.
Search for a command to run...
I’m Amir Rouhanipoor, an IT Consultant specializing in Azure and cloud solutions. I help organizations streamline their IT and drive growth through secure, efficient cloud technologies.
No comments yet. Be the first to comment.
Privileged Administrator Roles: Broad Scope: These roles grant extensive permissions across a wide range of Azure resources and services. They often have the ability to manage core aspects of your Azure environment, including users, subscriptions, a...
PowerShell Script for VM Size Comparison This script lists all session hosts with their host pool, VM name, and VM size across all host pools(loop through multiple resource groups): Connect-AzAccount # Get all host pools $hostPools = Get-AzWvdHostPo...
M03 - Unit 4: Configure an ExpressRoute Gateway Exercise Scenario To connect your Azure virtual network to your on-premises network using ExpressRoute, you must first create a virtual network gateway. A virtual network gateway serves two key purposes...
M02-Unit 3 Create and configure a virtual network gateway Scenario You will configure a VPN gateway to securely connect CoreServicesVnet (East US) and ManufacturingVnet (North Europe) using VNet-to-VNet VPN. Task 1: Create CoreServicesVnet and Manuf...
Introduction Azure ExpressRoute is a private, enterprise-grade connection that enables secure and reliable network connectivity between your on-premises infrastructure and Microsoft’s global network. It bypasses the public internet and provides high ...
You need to create three virtual networks: 1. CoreServicesVnet Region: East US Purpose: Main network (web services, databases, shared services like DC/DNS). Connectivity: Needs VPN connection to on-premises. Address Space: Large (because of expe...
Security-focused Cloud & Automation Engineer with a Master’s in Computer Science and 6+ years of experience automating and supporting enterprise IT environments across multi-site corporate and operational infrastructures. Proficient in Python scripting, Azure infrastructure, Windows Server, and identity management. Skilled in integrating third-party platforms, securing configurations, and streamlining operations. Currently pursuing the Cybersecurity Architect Expert certification with a strong focus on cloud security and automation.
Introduction
This lab provides hands-on experience with Azure Monitor, a powerful platform for collecting, analyzing, and acting on telemetry from your Azure and on-premises environments. You'll learn to create alerts, configure notifications, and explore Log Analytics to gain insights into your resources.
Definitions
Azure Monitor: A comprehensive service in Azure that provides a single platform for collecting, analyzing, and acting on telemetry from your cloud and on-premises environments. It helps you understand how your applications are performing and proactively identify 1 issues affecting them and the resources they depend 2 on. 1. learn.microsoft.com learn.microsoft.com2. github.com github.com
Alert Rules: Defined conditions that monitor your Azure resources and trigger notifications when those conditions are met. For example, you might create an alert rule to notify you if a virtual machine's CPU usage exceeds a certain threshold.
Action Groups: A collection of notification preferences that define how you want to be notified when an alert is triggered. This can include email, SMS, push notifications, or even automated actions like running an Azure Function.
Log Analytics: A tool within Azure Monitor that allows you to collect and analyze log data from various sources, including your Azure resources, applications, and on-premises systems. You can use Log Analytics to perform queries, create visualizations, and gain insights into your environment.
Alert Processing Rules: Rules that allow you to further customize the behavior of your alerts. This includes suppressing notifications during specific time periods, changing the severity of alerts, or adding additional actions to be taken when an alert is triggered.
Scenario
Your organization relies on Azure infrastructure. To ensure operational stability, you need to implement monitoring to detect and respond to critical events, such as virtual machine deletions. You'll use Azure Monitor to create alerts, define notification actions, and analyze logs.
Learning Objectives
By the end of this lab, you will be able to:
Deploy a virtual machine for testing monitoring scenarios.
Create alert rules in Azure Monitor.
Configure action groups to receive alert notifications.
Trigger an alert and verify its functionality.
Configure alert processing rules to manage alert behavior.
Use Azure Monitor Log Analytics to query resource data.
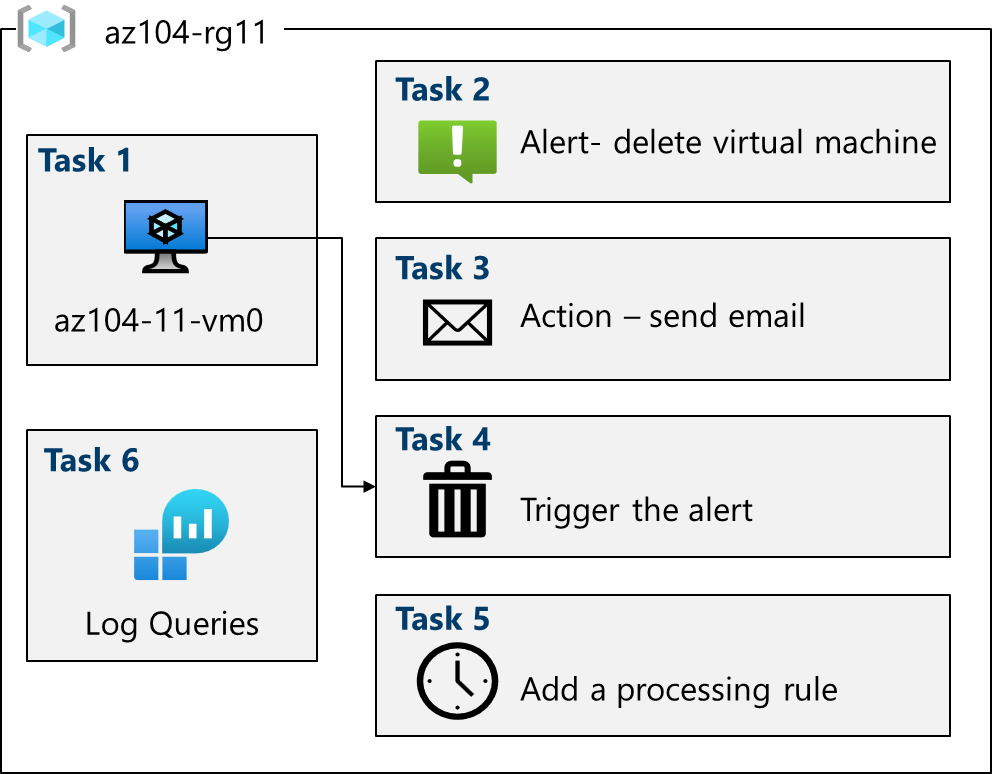
Task 1: Use a template to provision an infrastructure.
Task 2: Create an alert.
Task 3: Configure action group notifications.
Task 4: Trigger an alert and confirm it is working.
Task 5: Configure an alert processing rule.
Task 6: Use Azure Monitor log queries.
Task 1: Provision a Virtual Machine
Sign in to the Azure portal: https://portal.azure.com
Deploy from a custom template: Search for and select "Deploy a custom template" and select "Build your own template in the editor".
az104-11-vm-template.json file. and select "Save".Configure deployment:
Subscription: Your Azure subscription
Resource group: az104-rg11 (create new if needed)
Region: East US
Username: localadmin and strong password.
Deploy:
Select "Review + Create" and then "Create".
Wait for deployment to complete.
Go to the resource group to verify the virtual machine and network are deployed.
Task 2: Enable Azure Monitor for VMs
Navigate to Monitor: Search for and select "Monitor" in the Azure portal.
Enable VM Insights:
Select "Insights" in the left-hand menu.
Select "Virtual Machines" (under "Compute" if necessary).
Select your virtual machine and click "Enable".
Accept the defaults and select "Enable" again and then configure.
Allow a few minutes for the agent to install.


Go to Alerts: In the Monitor page, select "Alerts" in the left-hand menu.
Create an alert rule:
Select "Create +" and then "Alert rule".
Select the resource group (az104-rg11) and click "Apply".
Define the alert condition:
Select "Condition" and then "See all signals".
Search for and select "Delete Virtual Machine (Virtual Machines)".
Click "Apply".
In the "Alert logic" area, keep the default "Event level" and "Status" settings.


Create an action group: In the alert rule creation pane, select "Next: Actions" and select "Create action group".
Provide action group details:
Subscription: Your Azure subscription
Resource group: az104-rg11
Region: Global (default)
Action group name: AlertOpsTeam (or a unique name)
Display name: Alert the operations team
Configure email notification:
Select "Next: Notifications".
Notification type: Email/SMS message/Push/Voice
Name: VM was deleted
Select "Email" and enter your email address.
Click "OK".
Finalize alert rule:
Select "Next: Details".
Alert rule name: VM was deleted
Alert rule description: A VM in your resource group was deleted
Select "Review + create" and then "Create".


Delete the VM: Go to "Virtual machines" in the portal and select the az104-vm0 virtual machine.
and click "Delete", check "Apply force delete", and confirm the deletion.
Check for notification: Monitor the notifications in the portal and your email for the alert.
View alert details: In the Monitor blade, go to "Alerts" select the "VM was deleted" alert to see details.


Create a processing rule:
In the "Alerts" blade, select "Manage alert processing rules" at the top.
Click "Create" and then "Suppression rule".
Select your resource group and click "Apply".
Schedule suppression:
Suppression schedule: Recurring schedule
Start time: Today's date at 10 PM
End time: Tomorrow's date at 7 AM
Time zone: Your local time zone
Provide rule details:
Rule name: Planned Maintenance
Description: Suppress notifications during planned maintenance.
Select "Review + create" and then "Create".


no result!
Open Logs: In the Azure portal, search for and select "Monitor", then click "Logs" in the left-hand menu. (close the splash screen)
Set scope: Select your resource group (az104-rg11) and click "Apply".
Run pre-built queries:
In the "Queries" tab, select "Virtual Machines".
Run the "Count heartbeats" query.
Analyze the results.
Try a custom query:
Replace the existing query with the following and run it:Code snippet
  InsightsMetrics
  | where TimeGenerated > ago(1h)
  | where Name == "UtilizationPercentage"
  | summarize avg(Val) by bin(TimeGenerated, 5m), Computer
  | render timechart

Cleanup Resources
To avoid unnecessary costs, delete the resource group az104-rg11 after you've completed the lab.
Extend your Learning
Log Analytics Demo Environment: Practice with more log queries in a dedicated demo environment (provide a link if available).
Microsoft Copilot: Use Copilot to explore Azure Monitor further:
Ask questions like:
"What are the basic configuration steps to be alerted in Azure when a virtual machine is down?"
"How can I be notified when an Azure alert is triggered?"
"Construct an Azure Monitor query to provide virtual machine CPU performance information."
Self-paced training:
Improve incident response with alerting on Azure: [Link to relevant Microsoft Learn module]
Monitor your Azure virtual machines with Azure Monitor: [Link to relevant Microsoft Learn module]
Key Takeaways
Azure Monitor provides essential tools for monitoring your Azure resources.
Alert rules help you proactively identify and address issues.
Action groups enable you to define notification methods for alerts.
Alert processing rules offer fine-grained control over alert behavior.
Log Analytics allows you to query and analyze log data for deeper insights.